
Measuring marketing success is all about connecting what you do every day to real business results, like revenue and new customers.
It’s about setting clear goals, zeroing in on the right Key Performance Indicators (KPIs), and then using that data to prove your team’s value and make smarter moves.
Why Measuring Marketing Success Is Non-Negotiable

Let’s skip the obvious advice. The pressure on marketers today is real. Leadership doesn’t see marketing as just a creative cost center anymore; they expect it to be a predictable engine for revenue.
The days of justifying our work with soft metrics like “brand awareness” are long gone. Every dollar has to be accounted for.
This demand for accountability isn’t coming out of nowhere. Budgets are tight, and efficiency is the name of the game. Proving return on investment (ROI) has shot to the top of the priority list for marketing leaders.
It’s a huge shift. By 2025, a massive 83% of marketing leaders say proving ROI is their main focus. Even more telling, 64% of companies now decide future marketing budgets based on past ROI.
If you want to dive deeper, you can explore more data about marketing ROI statistics that highlight this trend. Measurement isn’t just a good idea—it’s a survival skill.
From Cost Center to Growth Driver
When you truly master measuring your marketing impact, you fundamentally change how your team is seen in the company.
You stop being the “make it pretty” department and become a strategic partner who directly contributes to the bottom line.
This shift unlocks some serious advantages:
- Secure Bigger Budgets: When you can walk into a meeting and show that every $1 you spend brings in$ 5 of revenue, those budget conversations get a whole lot easier.
- Earn a Strategic Seat: Data-backed insights on what actually drives customer acquisition and retention earn you a voice in high-level business strategy.
- Make Smarter Decisions: Good measurement takes the guesswork out of your job. You know exactly which channels deserve more investment, which campaigns to scale, and which ones to cut loose.
The real point of measurement isn’t just to fill out reports. It’s about getting the clarity you need to make confident, data-backed decisions that fuel real, sustainable growth.
It turns your marketing plan from a collection of hopeful tactics into a reliable, results-oriented machine.
Ultimately, turning measurement from a reactive chore into a proactive part of your strategy is the whole reason we’re here. It’s about more than just proving your worth—it’s about maximizing your impact.
Choosing KPIs That Tell the Right Story

Alright, this is where we get our hands dirty and move from abstract goals to concrete numbers. It’s also where we learn to sidestep the notorious “vanity metric” trap once and for all.
Sure, a spike in Instagram followers or a high impression count feels good, but do those numbers actually move the needle for the business? Probably not.
Real measurement begins when you pick Key Performance Indicators (KPIs) that are hardwired directly to your core business objectives.
Your goals should always dictate your metrics, never the other way around. If you’re trying to generate more marketing qualified leads (MQLs), boost customer lifetime value (LTV), or simply grab more market share, your KPIs need to be a direct reflection of that mission.
Aligning Metrics with Business Models
Think about how different business models demand different metrics. A SaaS company like Post Paddle, for example, is obsessed with acquiring subscribers who will stick around for the long haul.
Their most critical KPIs are all about efficiency and conversion.
They’ll be watching things like:
- Cost Per Acquisition (CPA): How much are we spending to land one new paying customer? This is their north star for campaign efficiency.
- Trial-to-Paid Conversion Rate: Of all the people who sign up for a free trial, what percentage actually become paying customers? This tells them how well their product and marketing resonate.
- Customer Lifetime Value (LTV): What’s the total revenue we can expect from a single customer over their entire relationship with us? This KPI dictates how much they can reasonably spend on acquisition.
Now, let’s flip the script and look at an e-commerce brand selling handcrafted goods. Their success isn’t just about getting a single sale; it’s about making each transaction as valuable as possible.
They’ll be focused on:
- Average Order Value (AOV): On average, how much does a customer spend in a single purchase? This is a key lever for growing revenue without needing more traffic.
- Cart Abandonment Rate: What percentage of shoppers put items in their cart but leave without buying? Nudging this number down is a quick way to boost sales.
- Return on Ad Spend (ROAS): For every single dollar we put into ads, how much revenue comes back? This keeps their advertising profitable and scalable.
To really get a handle on measuring marketing success, you need a solid grasp of these core indicators.
If you’re looking for more depth, check out a detailed explanation of key marketing metrics like CTR, CVR, LTV, and AOV.
Mapping KPIs Across the Funnel
No single metric can ever give you the full picture. To get an honest look at what’s working, you have to map your KPIs across the entire customer journey—from the moment someone first hears about you to the point they become a loyal advocate.
This approach is your secret weapon for spotting bottlenecks and uncovering hidden opportunities.
Focusing only on bottom-of-the-funnel metrics like sales is like only looking at the final score of a game without watching any of the plays. You miss the context and the crucial moments that led to the outcome.
Think about how each stage of the funnel tells a different part of the story:
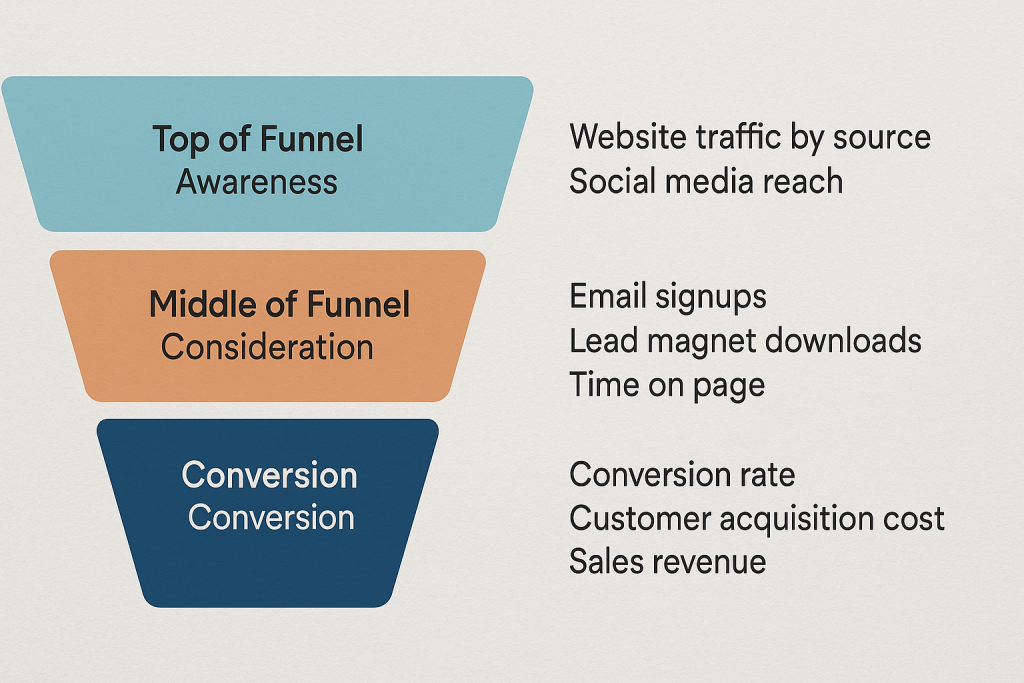
- Top of Funnel (Awareness): Metrics like website traffic by source and social media reach tell you if you’re even showing up in front of the right people.
- Middle of Funnel (Consideration): Here, KPIs like email signup rate, lead magnet downloads, and time on page show you if people are actually engaging with what you’re putting out there.
- Bottom of Funnel (Conversion): This is where the rubber meets the road. Metrics like conversion rate, customer acquisition cost, and sales revenue prove your direct impact on the bottom line.
This full-funnel view is absolutely critical for something like content marketing, where the journey from reader to customer is often a long one.
For a deeper dive, our guide on how to measure content performance can help you connect the dots.
When you choose the right KPIs, your data transforms from a confusing mess of numbers into a clear, compelling story about your marketing performance.
Building Your Marketing Analytics Stack
Once you’ve nailed down your KPIs, it’s time to build the engine that actually tracks them. This is your marketing analytics stack—a group of tools that work together to pull in, process, and show you your performance data.
The goal isn’t to grab every shiny new tool off the shelf, but to build a cohesive system that gives you a single, reliable source of truth.
At the heart of any solid stack are the fundamentals. For most of us, that starts with getting Google Analytics 4 (GA4) set up correctly.
And I don’t just mean dropping the tracking code on your site. You have to actively tell GA4 what success looks like for your business by creating conversion events for actions like form submissions, demo requests, or newsletter sign-ups.
This is your first real step from simply measuring traffic to measuring intent. Once GA4 knows what a conversion is, it can start connecting those valuable actions back to the channels and campaigns that drove them.
Suddenly, you have a much clearer line of sight into what’s actually moving the needle.
This image gives you a high-level look at how raw data from your channels gets transformed into reports you can actually use.
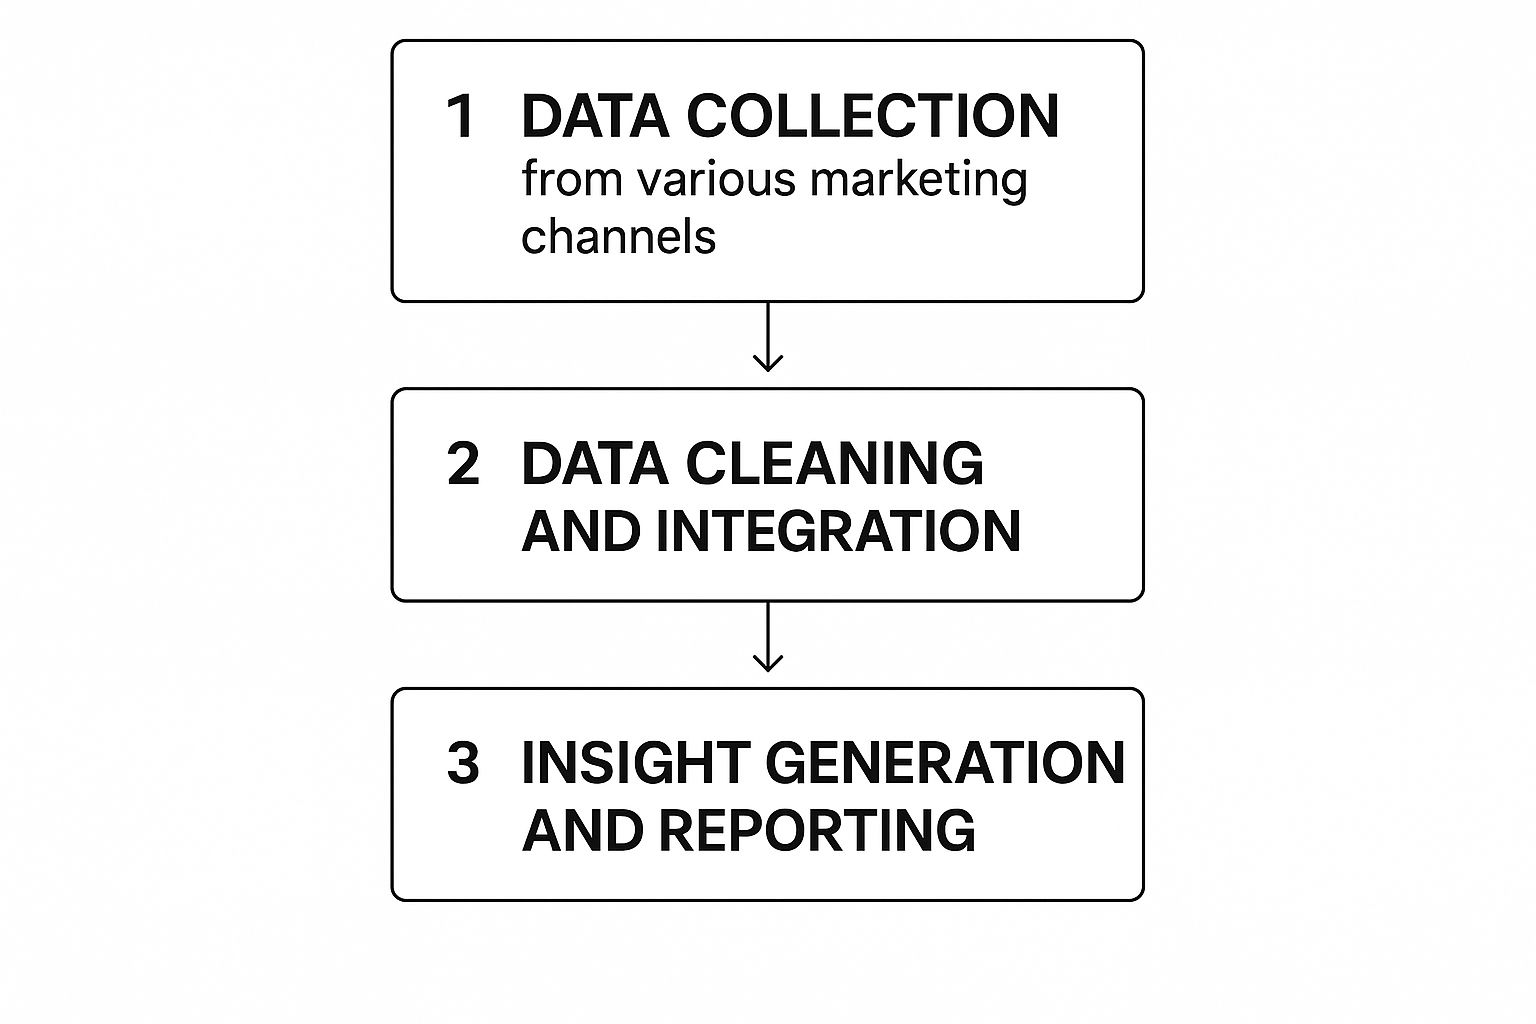
As you can see, collecting data is just the beginning. The real value is unlocked when you clean it up, connect it all, and analyze it to find insights that can shape your strategy.
Unifying Your Data Sources
Your website analytics is just one piece of a much larger puzzle. To get a complete picture of your marketing success, you need data to flow seamlessly between all your key systems.
A typical, effective stack usually has a few core components:
- Website Analytics: Google Analytics 4 is the undisputed standard for understanding how people behave on your site.
- Customer Relationship Management (CRM): Tools like HubSpot or Salesforce are essential for tracking the entire customer lifecycle, from their first visit to the final sale.
- Advertising Platforms: You’ll also need the native analytics from Google Ads, Meta, and LinkedIn to get granular, campaign-specific performance data.
The real magic happens when these tools talk to each other. For instance, connecting your CRM to your analytics platform lets you see not just which campaigns brought in leads, but which ones brought in high-value customers who actually closed.
If you want to dive deeper into making these connections work, check out our guide on marketing automation best practices.
The Power of Consistent Tracking
One of the most powerful—and surprisingly overlooked—tools in your stack is the humble UTM parameter.
These are just simple tags you add to the end of your URLs to tell your analytics tools exactly where a click came from.
A consistent UTM strategy is the difference between knowing “we got 100 leads from social media” and knowing “our ‘Summer Sale’ campaign on Instagram, specifically the video ad creative, generated 75 qualified leads with a cost per lead of $15.”
To make this work, you need a standardized system. It’s crucial that everyone on your team uses the same conventions for naming campaigns, sources, and mediums.
This discipline keeps your data clean, organized, and—most importantly—trustworthy. It transforms your analytics from a messy jumble of data points into a clear, actionable map of your marketing efforts.
The way businesses measure marketing success is also changing. It’s no longer just about these immediate metrics.
Across major industries, there’s a growing focus on metrics that reflect long-term customer engagement and loyalty. By 2025, many top brands are expected to prioritize Customer Lifetime Value (CLV) and the quality of engagement over short-term wins, a shift made possible by better analytics and personalization.
This long-term view requires a stack that can track the entire customer journey, sometimes over several years.
Connecting Digital Campaigns to Offline Revenue

For a huge number of businesses, the final “yes”—the signed contract, the in-store purchase, the scheduled service—doesn’t happen with a click.
This creates a massive blind spot. If you can’t connect your online campaigns to the money they’re actually generating offline, you’re flying blind.
This is especially true for local service businesses and retailers where a Google search or a Facebook ad directly leads to someone walking through the door.
The data doesn’t lie: 76% of people who search for a local business on their phone visit a store within 24 hours, and 28% of those visits result in a purchase.
Tying your digital efforts to those real-world actions is no longer a “nice-to-have”; it’s essential.
Practical Strategies for Bridging the Gap
So, how do you actually do it? Connecting online actions to offline sales requires a smart mix of tactics and tools.
The whole point is to create clear attribution paths that show you exactly which digital touchpoints are driving real-world results.
Here are a few powerful methods I’ve seen work time and again:
- Unique Promo Codes: This is a classic for a reason. Assign a different discount code to each campaign, like “PODCAST10” for a podcast ad or “FACEBOOK15” for a social campaign. When a customer uses that code in your store or over the phone, you know exactly where they came from. Simple and effective.
- Dedicated Landing Pages & Phone Numbers: For high-stakes campaigns, create a specific landing page with its own unique, trackable phone number. This lets you see precisely how many calls are being generated by that specific ad, giving you crystal-clear attribution.
- Google Business Profile Insights: Don’t sleep on this free tool. Monitor how many users clicked for directions to your physical location right from your search and map listings. It’s a direct signal of foot traffic being driven by your local SEO efforts.
The real challenge isn’t just about tracking one-off conversions. It’s about building a complete picture of the customer’s journey.
You need to understand how a blog post, a social ad, and a local search all worked in concert to bring a customer through your door.
Seeing It in Action
Let’s make this real. Imagine a local plumbing company running Google Ads. They use call tracking software, which assigns a unique phone number to their ad campaign.
A homeowner is in a panic, clicks the ad, and calls to book a service. Boom—the system immediately logs that call as a conversion, tied directly to that specific ad.
But it doesn’t stop there. Their CRM can then follow that lead all the way to a completed job and a paid invoice.
All of a sudden, they have a direct, undeniable line from ad spend to scheduled appointments to actual revenue.
That data is gold. It tells them which keywords and ad groups aren’t just getting clicks, but are actually making the phone ring with profitable business.
This same logic applies everywhere, including social media. Our guide on how to measure ROI on social media digs into specific strategies for making these vital connections.
Online vs Offline Conversion Tracking Methods
Choosing the right method depends entirely on your business model. Here’s a quick breakdown of some common approaches to help you see what might fit best.
| Tracking Method | Best For | Pros | Cons |
|---|---|---|---|
| Promo/Coupon Codes | Retail, E-commerce, Restaurants | Easy to implement and track; provides direct attribution per campaign. | Can be shared, potentially skewing data; may devalue brand if used too often. |
| Call Tracking | Service-Based Businesses | Provides direct evidence of leads from specific ads or landing pages. | Requires setup with a third-party service; doesn’t track non-phone conversions. |
| In-Store Surveys | Brick-and-Mortar | Simple, direct feedback (“How did you hear about us?”); captures qualitative data. | Relies on customer memory; can be inaccurate and hard to scale. |
| CRM Integration | B2B, High-Value Sales | Connects digital touchpoints to the entire sales cycle for a complete revenue picture. | Complex to set up; requires consistent data entry from the sales team. |
Ultimately, a combination of these methods often yields the most complete and accurate picture of your marketing’s true influence.
For those looking to get even more advanced, exploring marketing mix modeling can be a game-changer, helping you understand the incremental impact of every single channel.
Turning Data Into a Compelling Success Story

Collecting data is one thing; making it mean something is a whole different ball game. The real trick to measuring marketing success isn’t just about watching numbers go up or down.
It’s about turning that raw data into a clear story that gets your leadership team excited—a story about our wins, our lessons learned, and the massive opportunities ahead.
The first step is getting into a good rhythm with your performance reviews. You can’t just check the numbers whenever you feel like it. We treat it like a regular health check-up.
- Weekly check-ins are for the nitty-gritty. This is where we make small adjustments to live campaigns to keep them running smoothly.
- Monthly deep dives let us zoom out a bit. We’re looking at broader campaign performance and seeing how different channels are stacking up against each other.
- Quarterly strategy sessions are the big ones. This is where we look at long-term trends and decide if we need to make major changes to our overall marketing strategy.
From Data Points to Strategic Insights
Just spitting out metrics on a dashboard is useless. You have to be the translator. If the conversion rate on a key landing page suddenly dips, that’s not just a number—it’s a breadcrumb. Did we just push a new design live? Did a competitor roll out a huge discount?
You have to constantly ask “why” to get from simply seeing the data to actually understanding it.
Your job is to be a detective, always on the hunt for patterns that unlock growth. For example, the team at Post Paddle might dig into their analytics and see a glaring trend: blog posts about “Pinterest SEO” are bringing in way more trial sign-ups than any of their posts about “Pin Design.”
That single insight is gold. It immediately gives them a clear path forward.
- Double down on what works: Greenlight a whole new series of content focused on Pinterest SEO tactics. That’s a proven winner.
- Figure out what’s broken: Why is the design content falling flat? Is the call-to-action weak? Is it attracting a different type of reader who isn’t ready to buy?
- Create a new testable idea: “We think that if we add a mini-case study to our design-focused posts, we can boost trial sign-ups from that content by 15%.”
This isn’t just reporting on the past; it’s using the past to build a roadmap for the future.
Communicating Your Wins to Stakeholders
I can’t stress this enough: one of the most valuable skills you can build as a marketer is learning to speak the language of the C-suite.
Your CEO doesn’t need to know the click-through rate of your latest ad. They want to know how much it cost to acquire a new customer (CAC) and how your work is driving revenue.
It’s your job to connect the marketing dots to the business dollars.
When you’re building a report for leadership, cut the marketing jargon. Frame everything in terms of business outcomes.
Instead of saying, “Our email campaign achieved a 22% open rate,” reframe it like this: “Our latestemail campaign brought in 45 new qualified leads for sales, adding $30,000 to the potential pipeline.”
See the difference? The first is a marketing metric. The second is a business result. That simple shift changes the entire conversation and is exactly how you earn trust and secure bigger budgets.
When you present your findings, try this simple storytelling framework. It works every time.
- Start with the Goal: Remind everyone of the primary business objective we were all trying to hit.
- Show the Results: Immediately highlight the 2-3 most important numbers that show how we did against that goal (think MQLs, ROI, or actual sales).
- Share What You Learned: This is the “so what?” part. Explain what the data is telling you. What was surprising? What was a confirmation?
- Propose What’s Next: Based on what you learned, lay out the specific, data-backed actions you’re going to take next.
With this approach, you’re not just presenting a report. You’re confidently demonstrating the value your team brings to the table and telling a powerful story of marketing’s impact on the business.
Turn Your Marketing Data Into Clear Next Steps
If you’re serious about measuring marketing success, the next step is turning all those numbers into simple, confident decisions you can actually act on. That’s where Post Paddle’s free Pinterest GPT tools can really help.
Instead of staring at dashboards and spreadsheets, you can ask plain-language questions like “Which campaigns should I scale?” or “Why is this pin underperforming?” and get instant, data-aware guidance.
The tools can help you interpret performance metrics, spot patterns, and suggest what to test, pause, or double down on next.
Use them to break down confusing analytics, uncover which content is really moving the needle, and get fresh, performance-based ideas for future campaigns so your reports tell a clear ROI story instead of just numbers.
Common Questions We Hear About Measuring Marketing
Even with the best plan in place, you’re bound to hit a few tricky questions when you get down to the nitty-gritty of measuring your marketing.
Let’s walk through some of the most common ones I hear and give you some straightforward, practical answers to help you navigate these challenges.
How Often Should I Actually Report on Marketing Metrics?
The honest answer? It depends entirely on who you’re talking to. The whole point of reporting is to give someone the information they need to make a decision. Reporting just for the sake of it is a waste of everyone’s time.
Here’s a good rule of thumb:
- Your Internal Marketing Team: Weekly huddles work great. You’re in the trenches together, so focus on the tactical stuff—Click-Through Rate (CTR), Cost Per Lead (CPL), specific ad performance. These are the numbers that help you make quick adjustments to campaigns.
- Leadership and Other Departments: Think monthly or quarterly. They don’t need to see the daily fluctuations. You need to zoom out and connect your work to what they care about: Marketing Qualified Leads (MQLs), Customer Acquisition Cost (CAC), and the big one, overall Return on Investment (ROI).
The trick is to match the level of detail to the decisions your audience needs to make. Your team needs granular data; your CEO needs the bottom line.
What’s the Biggest Mistake People Make When Measuring Marketing?
Hands down, the single biggest mistake is getting sidetracked by vanity metrics instead of focusing on metrics that show real impact.
It’s an incredibly easy trap to fall into because vanity metrics feel good. We’ve all been there—getting excited about a huge spike in social media impressions. But if you can’t tie that spike to more website traffic, more qualified leads, or more sales, what did it actually accomplish?
If there’s one habit to build, it’s tying every single marketing activity back to a concrete business goal. If a metric doesn’t help you understand how you’re impacting revenue or customer growth, it’s probably just noise.
Always ask yourself the “So what?” question. Impressions went up by 50%? So what? If you can’t answer that with a meaningful business outcome, you’re looking at the wrong number.
How Can I Measure the ROI of My Content Marketing?
This is a tough one for a lot of marketers. Measuring content ROI feels messy because a blog post or an ebook is often just one small step in a very long customer journey. But it’s absolutely doable if you set things up correctly.
Start with the direct-response stuff. Track the leads that come straight from your content—people who download an ebook, fill out a form after reading a case study, or sign up for a webinar. That’s your baseline.
Then, you need to lean on your CRM. Follow those specific leads through your sales pipeline and see how many of them actually become paying customers.
Once you know the total revenue they brought in, you can compare it to what you spent on creating and promoting that content.
Don’t forget to look at “assisted conversions” in your analytics, too. This tells you how often your content was a touchpoint along the way, even if it wasn’t the final click that led to a sale.
What’s the Best Tool for Marketing Analytics?
This is a bit of a trick question because there’s no single “best” tool. The smartest marketers don’t rely on one magic-bullet platform; they build an analytics stack that works for their specific business.
For most businesses, a solid starting stack usually includes:
- Google Analytics 4: For getting a deep understanding of what people are doing on your website.
- A CRM (like HubSpot or Salesforce): This is crucial for tracking a lead all the way from their first interaction to becoming a loyal customer.
- Native Platform Analytics: The built-in reporting from Google Ads, Meta Ads, and other ad platforms gives you the most detailed campaign data.
The real secret isn’t finding one perfect tool. It’s making sure these different systems are integrated and can talk to each other.
When data flows smoothly between them, you get a complete picture of your marketing performance from start to finish.